 2 hours ago
4
2 hours ago
4 ARTICLE AD
The combined market capitalisation of all cryptocurrencies, excluding Bitcoin, is at the $1 trillion major support. Another $80 billion could be about to get erased from altcoins if this support fails.
Total2 at critical support
Source: TradingView
These are scary times for those holding altcoins. We are supposed to be in the midst of a bull run, but the bleed-out in cryptocurrencies just does not appear to want to stop. Currently, the altcoin market cap is just at the conjunction of the 0.618 Fibonacci and the rising trendline. If this support fails, the next stop is the 0.786 Fibonacci at $919 billion.
Of course, some may say that the 39% that the altcoins market cap has already fallen from the top can be considered quite normal for a bull market. In fact, the previous bull market saw a drop of 60% before a rally up and past the previous all-time high.
A similar correction this time could see the altcoins market cap going nearly all the way back to the $620 billion absolute bottom support. Not a scenario that would inspire confidence for getting much above the current all-time high by the end of this bull market.
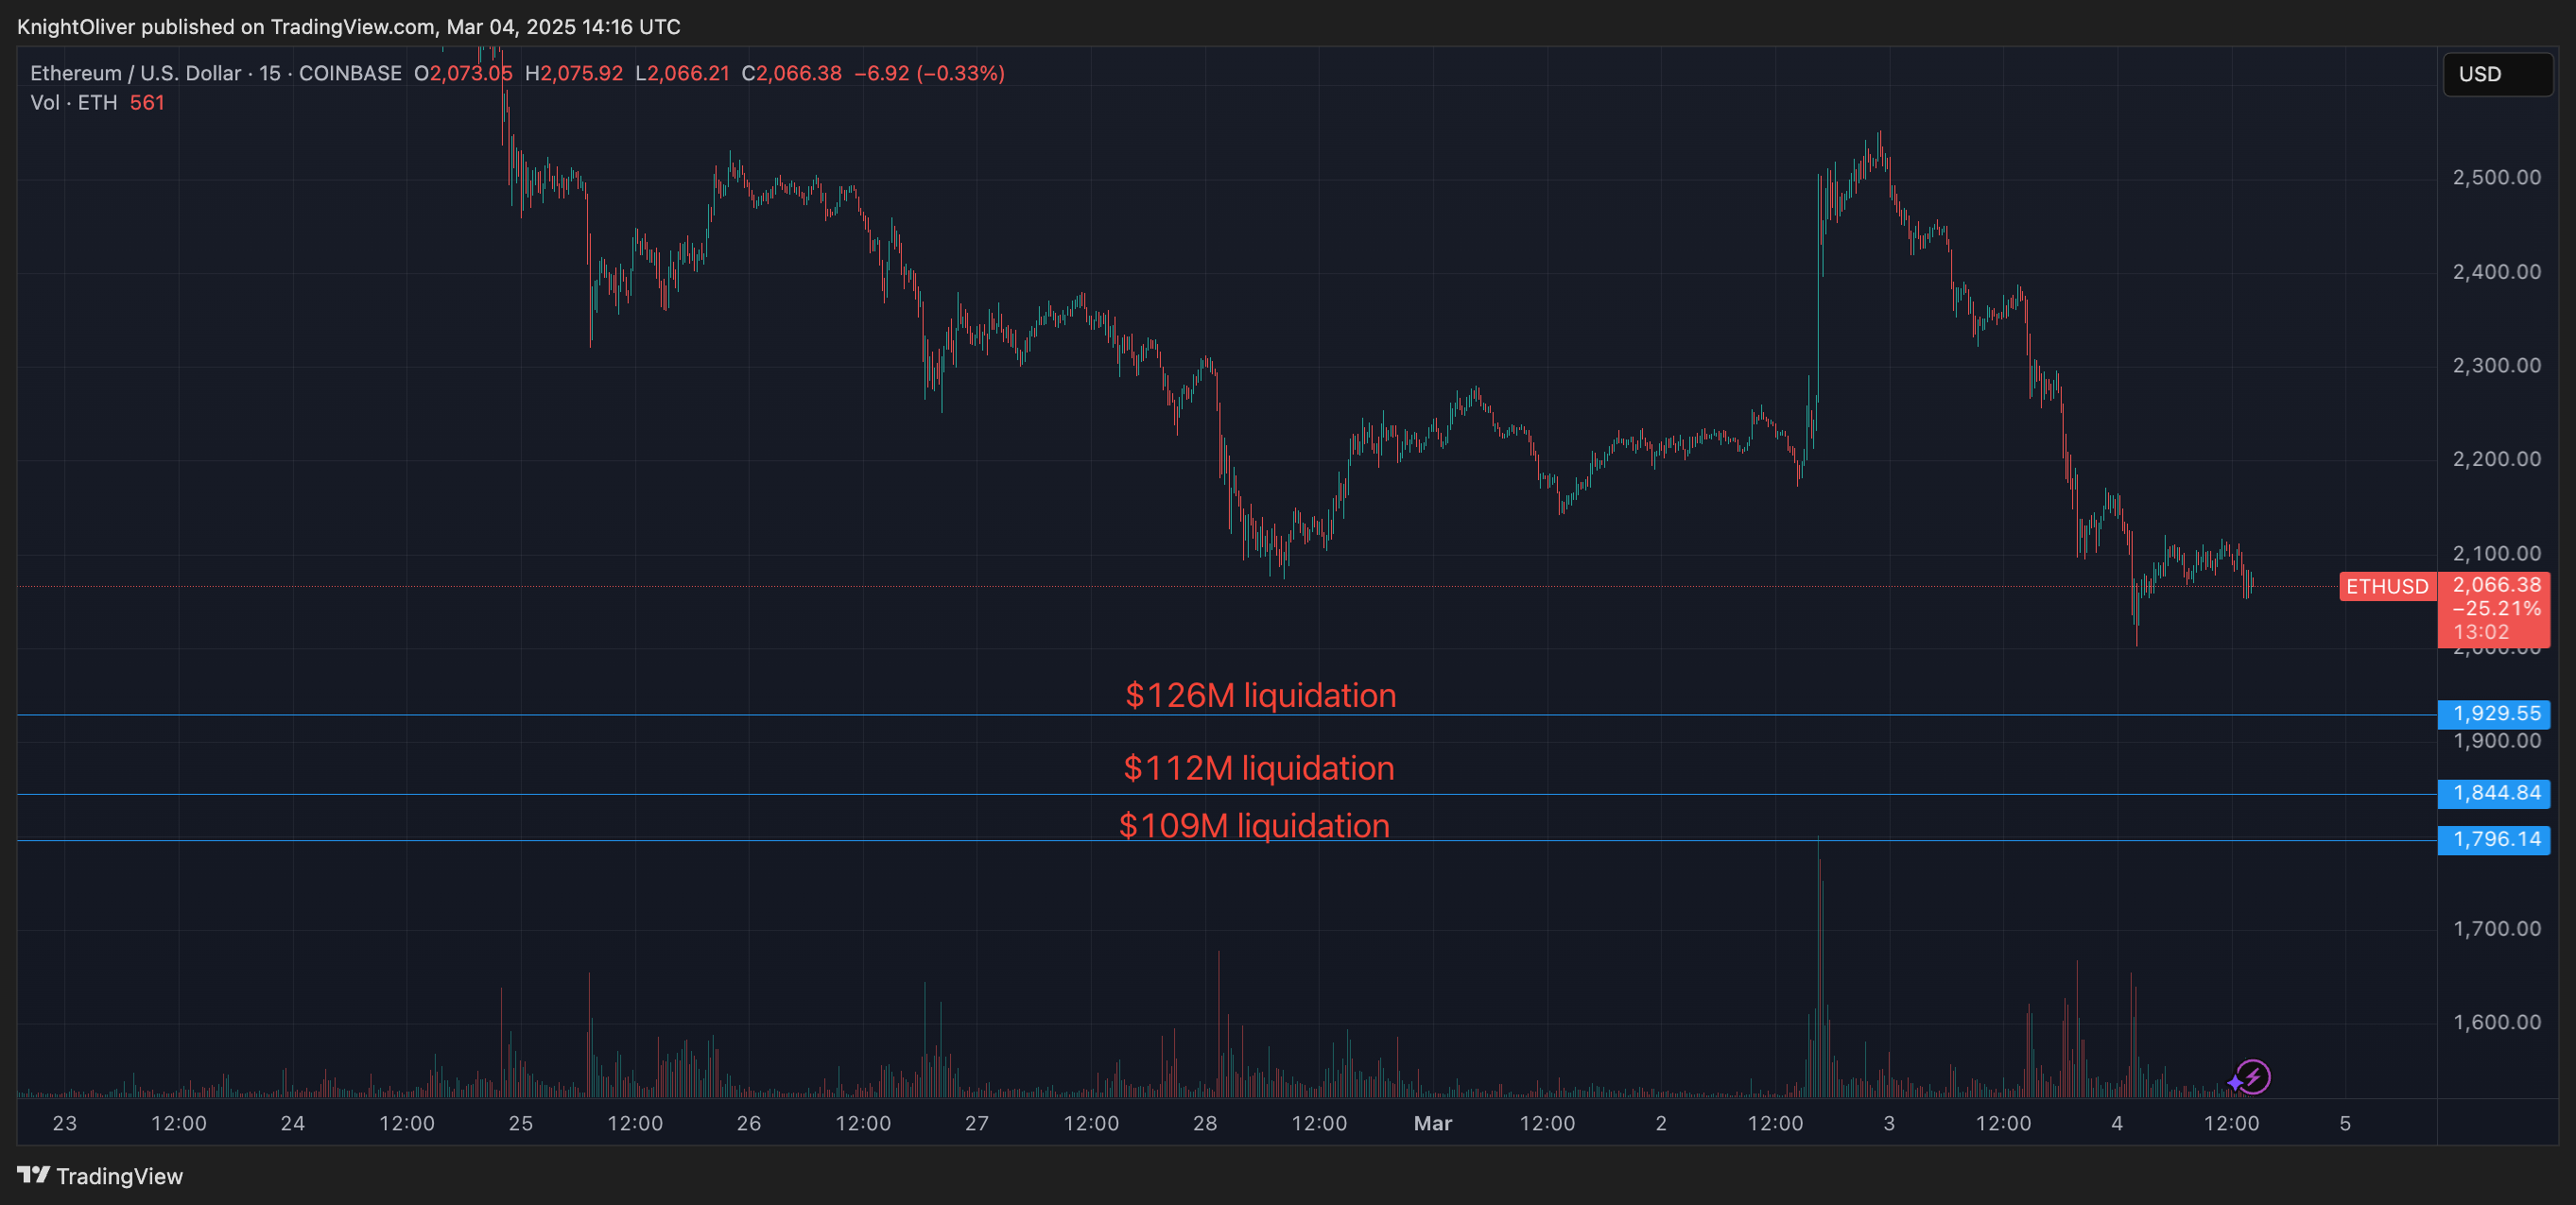
$ETH on brink of disaster
Source: TradingView
Probably the canary in the coalmine for the health of the altcoins is Ethereum (ETH). If this one drops, there is a very big likelihood that the rest will follow.
$ETH is once again sitting on the brink of disaster. The price is at the very lowest level of the band of major support, and is only just above the bull market trendline, which stretches all the way back to July 2020. If this fails, and the price consolidates below, we might have to say goodbye to this current bull market.
Will the $SOL bull trendline confirm as failed?
Source: TradingView
Solana (SOL) is the major layer 1 smart contract competitor to Ethereum, and as can be seen in the chart above, the bull market trendline has already potentially failed. The price has come well down below it, and the current monthly candle is looking to confirm the breakdown.
That said, there is still the rest of this month to go, and anything can still happen. Very strong horizontal support is just below the price, and the Stochastic RSI momentum indicator is approaching the bottom. If one looks back at the last time the Stochastic RSI was this low, it was at the beginning of the bull run for $SOL.
There is a scenario where the price could still pierce through the support band and hit the $100 horizontal support level. If it didn’t turn back up from there the bull run for $SOL could be over. That said, If it did turn back up, and the monthly Stochastic RSI started to rise, who knows how far $SOL could eventually go.
Disclaimer: This article is provided for informational purposes only. It is not offered or intended to be used as legal, tax, investment, financial, or other advice.