ARTICLE AD
Bitcoin may be experiencing a price recovery towards the $57,000 level after a sharp 20% drop on Monday that sent the largest cryptocurrency on the market to a low of $49,000 not seen since February. Still, BTC is not out of the woods yet, as a concerning pattern has emerged on its 10-day chart.
Analysts Spot Bearish Signals
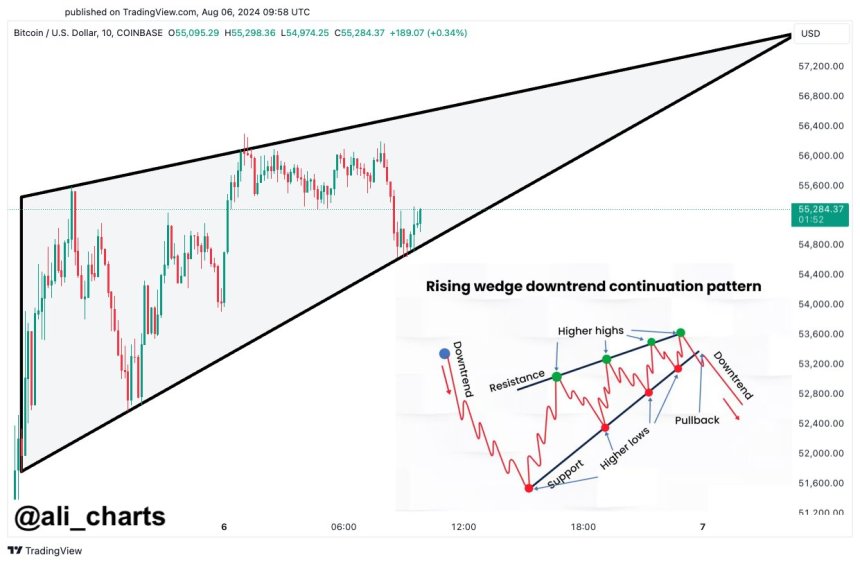
According to technical analyst Ali Martinez, Bitcoin is forming a rising wedge pattern, a bearish continuation pattern often linked to further downtrends.
While BTC may climb as high as $57,000 at the upper boundary of the wedge, Martinez warns that investors should look for a potential breakdown that could pull the cryptocurrency back down to around $51,000.
 BTC’s rising wedge pattern on its 10-day chart. Source: Ali Martinez on X
Martinez also highlighted that one of Bitcoin’s key support levels, based on its market value to realized value (MVRV) pricing bands, is currently at the $54,000 mark. This level is crucial in preventing a more substantial drop towards the $40,000 region. Conversely, if the $54,000 support holds, the analyst sees the key resistance on the upside at $67,000.
Another analyst, Rekt Capital, has also observed that Bitcoin is showing signs of attempting to recover and fill the new CME gap above with the currency’s current price recovery of 4.5% recorded in the last hours, which ranges from $59,400 to $62,550. However, the analyst noted that a smaller CME gap has formed at a slightly lower level, between $53,700 and $54,600, which any short-term dip in the market could potentially fill.
Reasons For Optimism In Bitcoin Market
Amidst these bearish technical indicators, there is a glimmer of optimism, as according to Ki Young Ju, the founder and CEO of market analysis firm CryptoQuant, several key metrics suggest that the bull market remains intact despite the recent pullback.
According to Ju, one of the key signs is the recovery in Bitcoin’s hashrate, a measure of the computing power dedicated to the network. Ju contends that miner capitulation is nearly over, with the hashrate nearing all-time highs.
This is significant, as US mining costs are approximately $43,000 per BTC, indicating that the hashrate will likely remain stable unless prices dip below this level.
Additionally, Ju has observed significant inflows of Bitcoin into custody wallets, indicating that large institutional investors, or “whales,” are actively accumulating digital assets.
The analyst noted that Permanent Holder addresses, which hold their Bitcoin for over 3 years, have increased by 404,000 BTC, including 40,000 BTC in US spot Bitcoin exchange-traded funds (ETFs) over the past 30 days.
In contrast to the increased whale activity, Ju has observed a relative absence of retail investors, similar to the market conditions in mid-2020. This could be interpreted as a positive sign, as it indicates that the current price movements are not driven by speculative froth but rather by institutional investors’ strategic accumulation of Bitcoin.
Lastly, Ju noted a reduction in the selling pressure from long-term Bitcoin holders, or “old whales,” who sold their holdings to new whales between March and June.
The analyst believes that the lack of significant selling pressure from these experienced investors is a bullish signal, as it suggests that a new generation of institutional players is now shaping the market with a more long-term outlook.
At the time of writing, BTC is struggling to break above its current price level of $56,670 while trimming losses in larger time frames, which amounted to 13% last week.
Featured image from DALL-E, chart from TradingView.com

 3 months ago
27

