ARTICLE AD
On-chain data suggests Bitcoin has been going through one of its longest profit-taking events in the past five years over the last few months.
Bitcoin Has Observed Profit-Taking For Around 90 Straight Days
In a new post on X, analyst James Van Straten has discussed about the profit-taking spree currently ongoing in the Bitcoin market. The indicator of relevance here is the “Net Realized Profit/Loss” from Glassnode, which keeps track of the net amount of profit or loss being realized by users on the BTC network.
The metric works by going through the transaction history of each coin being transferred on the blockchain to see what price it was moved at prior to this latest movement.
Assuming that both the transfers of the coin involved a fresh change of hands (that is, buying and selling occurred), this move would have realized a profit or loss equal to the difference between the two prices.
Naturally, the previous spot price being higher would mean the coin’s sale realized some loss, while it being lower would suggest its owner harvested some gains.
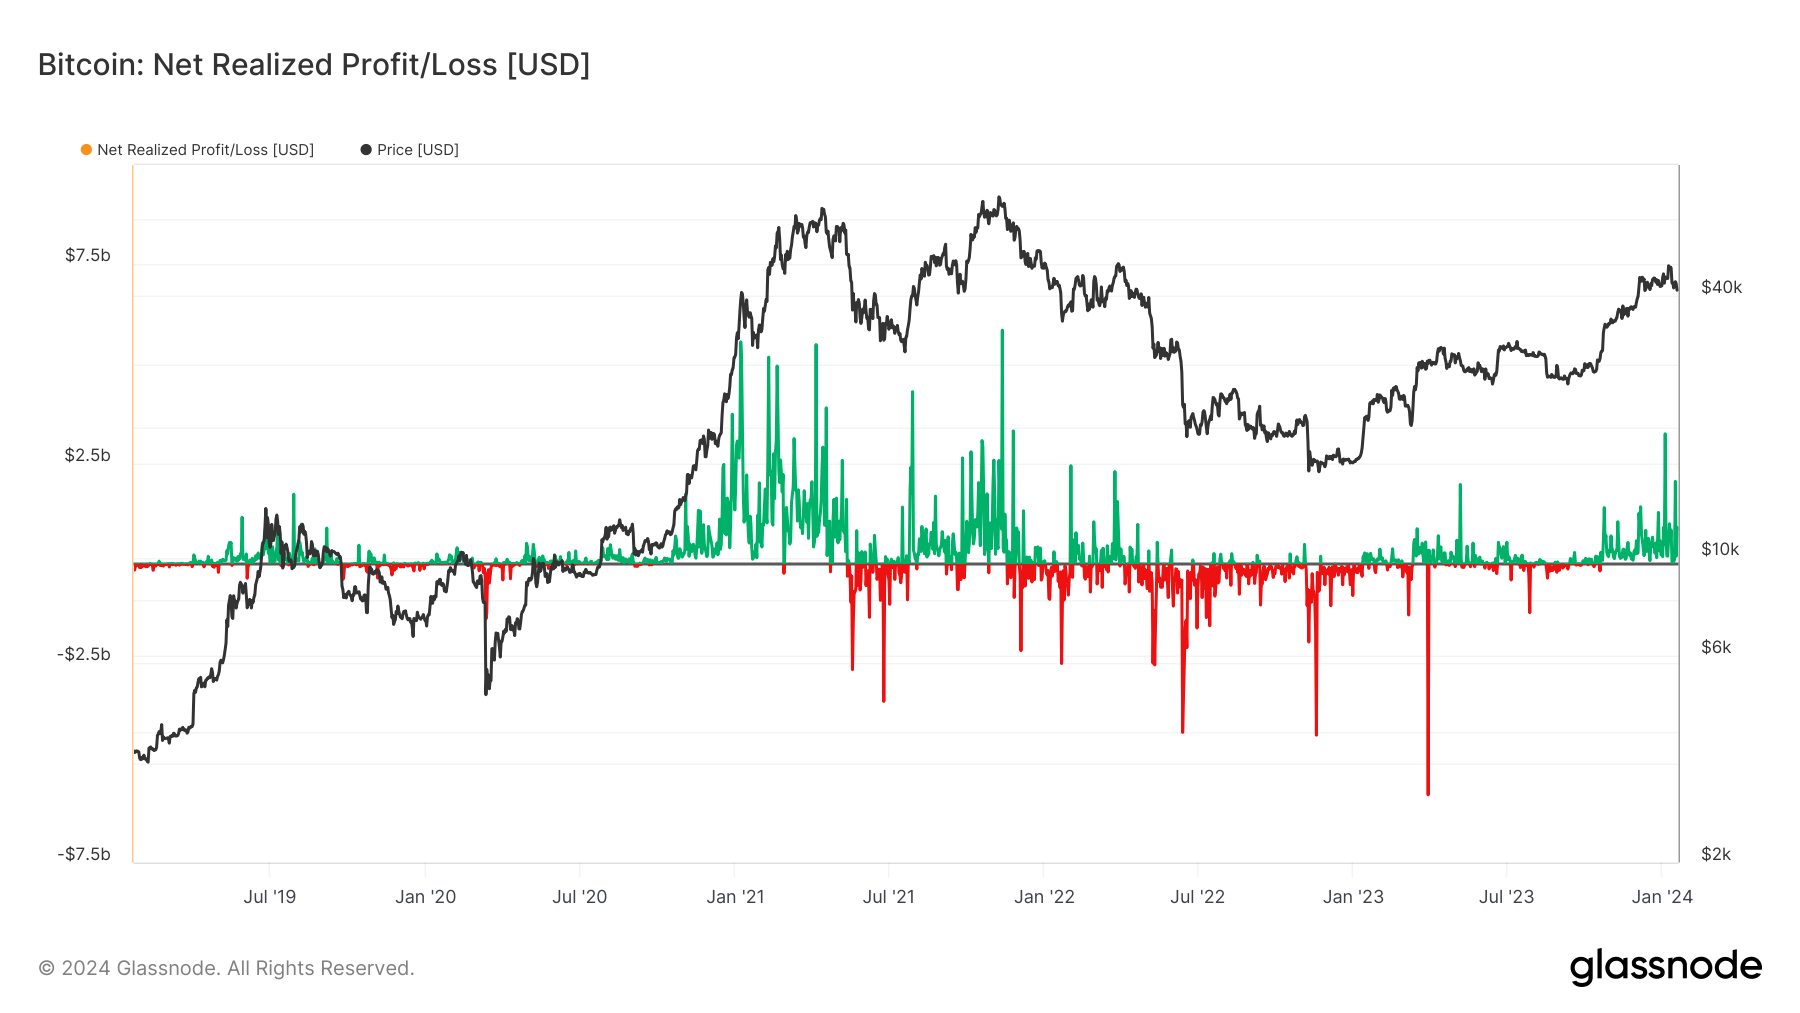
Now, here is a chart that shows the trend in the Bitcoin Net Realized Profit/Loss over the last few years:
When the Net Realized Profit/Loss has a positive value, it means the Bitcoin investors are realizing profits right now. On the other hand, it being underwater implies loss realization is the dominant form of selling currently.
From the graph, it’s visible that profit-taking has been what BTC users as a whole have been leaning into recently, as the indicator has had some notable green values.
The latest positive values of the Net Realized Profit/Loss have in fact gone on for about 90 days now, which suggests the investors have been harvesting net profits for a while now.
This profit-taking streak is one of the longest the cryptocurrency has witnessed during the last five years. The single longest streak in this period came during the 2021 bull run, where profit realization was dominant for 155 straight days.
A few times during the latest run, the indicator has come close to breaking into the negative territory, but each time it has rebounded back up into the green zone.
This is naturally due to the fact that the Bitcoin price has generally gone up over the last few months, so the investors would have been continuously getting into profits.
Recently, though, BTC has found some struggle as its price has seen some notable drawdown. It’s possible that this may result in an exhaustion of profit-sellers, which could finally lead to an end of the streak.
Bitcoin Price
At the time of writing, Bitcoin is floating around the $41,000 level, down over 3% in the past week.
Featured image from Yiğit Ali Atasoy on Unsplash.com, charts from TradingView.com, Glassnode.com

 1 year ago
81


