ARTICLE AD
Bitcoin (BTC) has shown an impressive performance in the first quarter (Q1) of 2024, as highlighted in a recent report by market intelligence data research firm Messari. The research firm finds key factors contributing to Bitcoin’s price increase, market cap dominance, and the emergence of new trends in the cryptocurrency ecosystem.
Inscription Activities Drive Bitcoin Fees Up
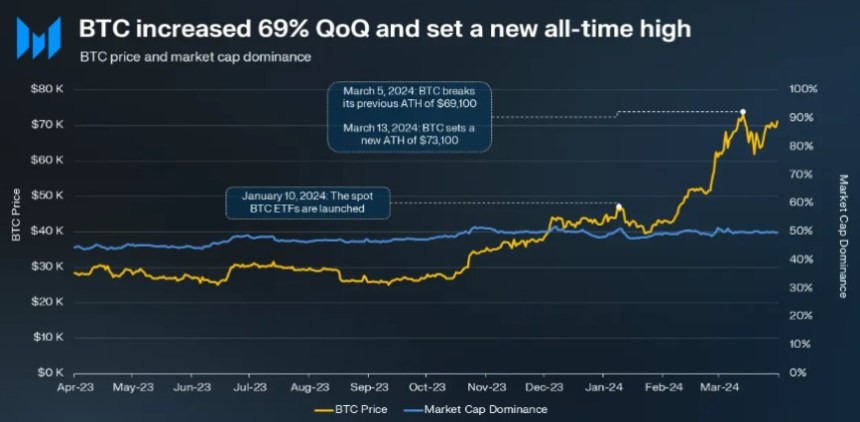
Analyzing the key figures detailed in the report, Bitcoin’s price experienced a significant increase in Q1 2024, rising 68.78% quarter-over-quarter (QoQ) to reach an all-time high (ATH) of $73,100.
This price increase propelled Bitcoin’s market cap dominance to 49.7% in March 2024. Interestingly, the research firm notes that such dominance is a typical feature at the start of a new halving cycle, with Bitcoin often leading the way for other cryptocurrencies.
 BTC’s price increase QoQ. Source: Messari
Another relevant figure is the inscription activity in Q4 2023, which drove fees up by 699.4% QoQ. However, in Q1 2024, subscription-related fees decreased by 41.9%. Despite declining total fees, inscription-related transactions still accounted for 18.4% of Bitcoin’s total fees, demonstrating their continued relevance.
Average daily transactions and daily active addresses also experienced a decline of 15.3% and 4.7% QoQ, respectively. The report suggests that the decline in transaction activity may be attributed to decreased activity from bots or “super users.” This shift aligns with the decrease in inscription-related activities and fees.
Inscription-related activity initially surged in February 2023, leading to a considerable transaction increase. Although Q1 2024 witnessed a decline in inscription-related activity QoQ, it remained significantly higher year-over-year (YoY), indicating its continued impact on the network.
ETFs Amassed 212,000 BTC In Q1
Messari highlights that Q1 2024 showed the growth of programmable layers in the cryptocurrency ecosystem. Established layers such as Rootstock and Stacks led the way regarding total value locked (TVL), while newer layers such as BOB and Merlin experienced rapid growth.
TVL’s 127% QoQ growth was primarily in non-BTC assets, as Bitcoin-locked amounts lagged behind the Lightning Network and alt-L1 networks, which host significant amounts of BTC.
Ultimately, the approval and launch of nine spot ETFs and one ETF conversion marked a significant milestone for Bitcoin’s legitimization by the US government and traditional finance (TradFi).
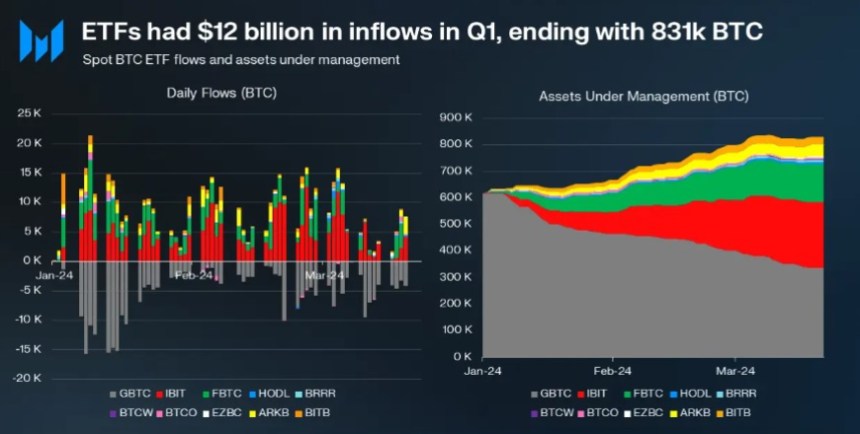
The report notes that these ETFs garnered over $12 billion in inflows within the first month. Notably, BTC ETFs surpassed silver ETFs in assets under management (AUM) but still lagged behind gold ETFs.
 Spot Bitcoin ETFs inflows during the first three months of trading. Source: Messari
Institutional BTC holdings were also surpassed by MicroStrategy, the largest institutional holder, with 215,000 BTC. The ETFs accumulated 212,000 BTC in inflows during Q1, further establishing Bitcoin’s prominence in the financial markets.
Bitcoin’s exceptional performance in Q1 2024, marked by a significant price increase and market cap dominance, has solidified its position as the leading cryptocurrency.
Anticipation for the supply halving, along with the success of BTC ETFs and institutional inflows, has contributed to Bitcoin’s growth and recognition in traditional finance.
Featured image from Shutterstock, chart from TradingView.com
Disclaimer: The article is provided for educational purposes only. It does not represent the opinions of NewsBTC on whether to buy, sell or hold any investments and naturally investing carries risks. You are advised to conduct your own research before making any investment decisions. Use information provided on this website entirely at your own risk.

 9 months ago
57

