ARTICLE AD
Bitcoin has observed a rally beyond the $71,000 level during the past day as on-chain data shows demand for the coin has notably increased.
Bitcoin Apparent Demand Has Spiked To Notable Positive Levels Recently
As an analyst in a CryptoQuant Quicktake post explained, the demand for Bitcoin has appeared to be on the rise again recently. The on-chain metric of interest here is the “Apparent Demand,” which keeps track of the difference between the BTC production and the changes in its inventory.
The only way to produce BTC is by adding new blocks to the chain and receiving block subsidy as compensation, so the asset’s production is equated to the amount that the miners are getting in rewards every day, known as the Issuance.
BTC’s ‘inventory’ can be considered part of its circulating supply, which has been sitting still for more than a year. Thus, the changes in the inventory would be the net number of tokens maturing into or exiting out of this group.
Now, here is a chart that shows the trend in the Bitcoin Apparent Demand since the start of the year 2024:

As displayed in the above graph, the Bitcoin Apparent Demand had slumped to levels around the neutral mark during the earlier phase of consolidation that the asset had gone through. Still, recently, its value has surged to notable positive levels.
After the increase, the indicator has reached the same high as in February of this year. From the chart, it’s visible that what followed back then was BTC’s rally to a new all-time high (ATH).
So far, the recent burst of demand has also accompanied a fresh rally in the cryptocurrency’s price, which has taken the asset above the $72,000 level. Given the trend that occurred in the first quarter of the year, it’s possible that BTC could enjoy further upside if the Apparent Demand continues its growth.
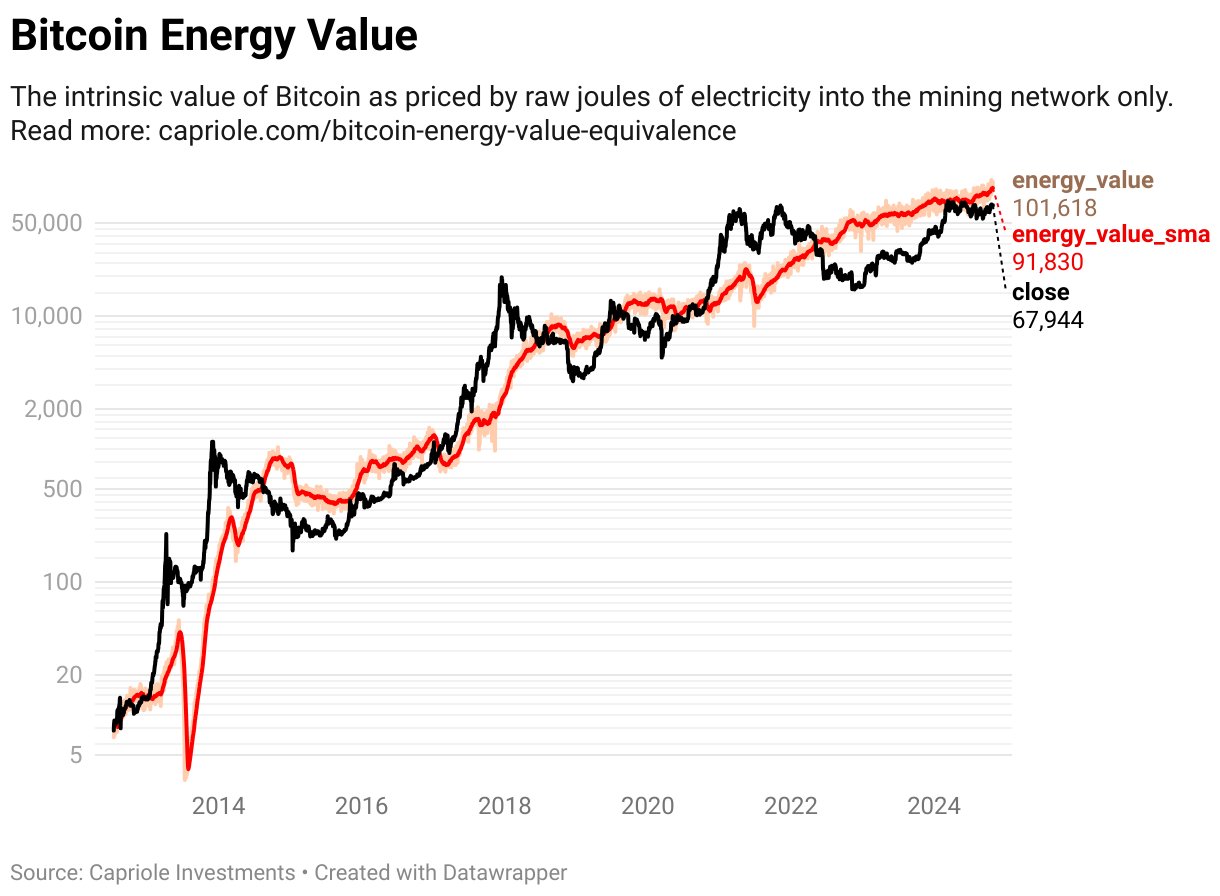
In other news, the Bitcoin Energy Value has recently crossed the $100,000 level, as Capriole Investments founder Charles Edwards explained in an X post.
The “Energy Value” here refers to a model for the cryptocurrency that calculates its fair value as a function of the amount of energy (measured in Joules) spent to produce it. The energy here is naturally the one miners use to power their computing machines with, to perform the task of BTC mining.
Here is the chart for the metric shared by the analyst:
The graph shows that this is the first time that the Bitcoin Energy Value has broken beyond this level.
BTC Price
At the time of writing, Bitcoin is trading at around $72,400, up almost 8% over the past week.
Featured image from Dall-E, CryptoQuant.com, Capriole.com, chart from TradingView.com

 3 weeks ago
37


