ARTICLE AD
The BNB Smart Chain (BSC) experienced a mixed performance in the second quarter (Q2) of the year as the broader cryptocurrency market cooled off after a strong price surge in March. While BNB, the native token of the BSC, remained mostly flat, down 5% quarter-over-quarter (QoQ), the network’s key metrics showed both positive and negative trends.
Binance Smart Chain Revenue Plunges
According to a recent report by market intelligence platform Messari, the chain’s revenue, which measures the total fees collected by the network, fell 28% QoQ to $48.1 million during Q2, although it was only down 8% year-over-year from $52.4 million in Q2 2023.
According to the report, this decline was largely driven by the decrease in BNB’s price, as revenue in the network’s native token terms declined 51% sequentially from 165,100 BNB to 81,300 BNB.
The report also highlighted a decline in network activity, with average daily transactions decreasing 10% QoQ to 3.7 million and average daily active addresses dropping 18% QoQ to 1.1 million. This trend was not isolated to the BSC, as on-chain activity decreased across most smart contract platforms in Q2 following a strong Q1.
Despite the overall decline, the report noted notable shifts in user preferences within the BSC ecosystem as decentralized exchange (DEX) Uniswap experienced a significant increase in daily transactions, up 630% QoQ, while the previously dominant PancakeSwap saw a 46% QoQ decrease.
Staking Surges 30%, TVL Drops
Messari also highlighted that the total BNB staked increased 30% QoQ to 30.4 million BNB, with the total dollar value of staked funds increasing 24% to $17.7 billion. This ranks the Binance Smart Chain as the third-highest Proof-of-Stake (PoS) network by staked value, though it still lags behind the Solana blockchain by a significant $38.4 billion.
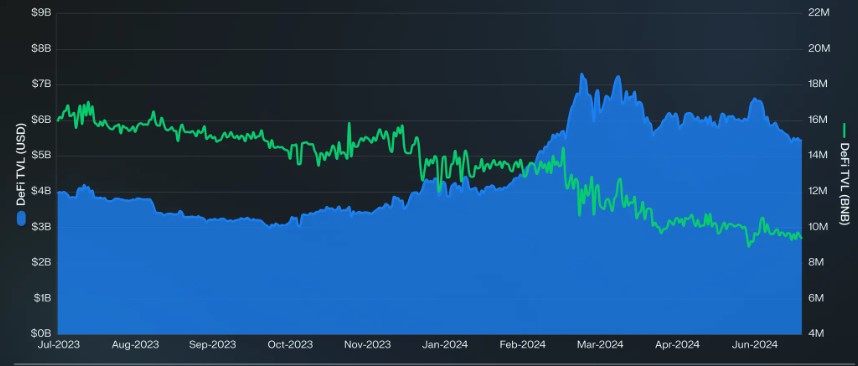
The BSC’s decentralized finance (DeFi) ecosystem, however, saw a decrease in total value locked (TVL), down 24% QoQ to $5.5 billion, primarily driven by a 41% QoQ drop in borrowing on the DeFi protocol, Venus Finance.
 Binance Smart Chain’s TVL in USD and BNB. Source: Messari
The company notes that this indicates that the overall decrease in value locked was partially due to the drop in value of the BNB token, which closed the quarter at a low of $567 after reaching an all-time high of $722 in March.
Despite these fluctuations, Messari reported that the Binance Smart Chain maintained the third-highest decentralized exchange (DEX) trading volume during the second quarter of the year, with $66 billion in total volume, trailing only Ethereum (ETH) and Solana.
BNB Price Analysis
At the time of writing, the BNB token was trading at $586, up over 2% in the last 24 hours. However, trading volume in the last 24 hours was down 3% to $830 million, according to CoinGeko data.
Since Friday, the token has been consolidating between $570 and the current trading price, following the lead of the largest cryptocurrencies on the market, after a failed attempt on Monday to break through its nearest resistance wall at $590, which is the last obstacle preventing a move upwards to the $600 milestone.
Conversely, the key level to watch for BNB bulls is the 200-day exponential moving average (EMA) noted on the daily BNB/USDT chart below, with the yellow line just below the current price, which could act as a key support for the token, potentially preventing further declines.
Featured image from DALL-E, chart from TradingView.com

 3 months ago
38

