
 1 month ago
12
1 month ago
12 ARTICLE AD
The cryptocurrency market continued its strong start to the week, with almost all major cryptocurrencies in positive territory. Bitcoin (BTC) is up over 2% in the past 24 hours and briefly climbed above $66,000 before dropping to its current level of $65,500. Ethereum (ETH) also registered a substantial increase, rising by almost 3% over the past 24 hours to climb above $2,600, breaking above key resistance levels.
Other cryptocurrencies that registered substantial gains are Solana (SOL), Dogecoin (DOGE), Toncoin (TRON), Chainlink (LINK), Polkadot (DOT), Internet Computer (ICP), and several others. The overall crypto market cap is up by 2.06% and currently sits at $2.29 trillion, with gains largely driven by multiple bullish developments, including China’s stimulus.
Bitcoin (BTC) And Other Assets Register Substantial Gains
Bitcoin (BTC) surged to its highest level in weeks as it briefly climbed above $66,000 following a reaction to China’s latest stimulus effort, which has fueled speculation that investors will turn to crypto assets instead of Chinese equities. China’s attempt to revive its floundering economy has left many investors uncertain. This is also because the announcement did not define the amount of stimulus that will be injected into the market. Caroline Mauron, the co-founder of Orbit Markets, explained the mood in the market, stating,
“Markets are probably taking a disappointing China stimulus to be positive news for bitcoin, as capital rotation from bitcoin into Chinese equities was understood to be previously weighing on crypto prices.”
The measures could suggest a lack of clarity in China’s economic measures and prompt investors to shift their capital to alternative assets such as cryptocurrencies instead of Chinese stocks. The US presidential race has also played a key role in the recent positive price action. Prediction markets have recently shifted in favor of Donald Trump, raising his chances of winning the election. Mt. Gox’s decision to postpone the deadline to repay creditors by another year has also contributed to the recent positive sentiment.
“The recent improvement in Trump polling will amplify the market’s receptiveness and the positive price impact of good news. Good news such as the Mt. Gox delayed repayment plan will be received more positively.”
Crypto Short Liquidations Breach $100M
Crypto derivatives traders who bet on the crypto market falling have been liquidated for over $100 million over the past 24 hours as the price of BTC surged past $65,000. According to data from CoinMarketCap, BTC peaked at $66,500 earlier today, its highest level in weeks, as the crypto market makes a broad recovery. 54,649 traders were liquidated for over $166 million, with BTC shorts accounting for $52.33 million of the last day’s total, followed by Ethereum (ETH) shorts at $27 million. BTC’s recent surge also pushed its market dominance to 58%, close to levels last seen in April 2021.
Analysts have also stated that the so-called “Uptober” is finally set to begin, with one saying on X that the “tides are shifting” and the market was heading into one of its most exciting phases.
South Korean Province Seizes $890,000 Worth Of Crypto
South Korea’s North Gyeongsang province has seized crypto assets worth $890,000 from crypto wallets of residents who have failed to pay local taxes. The province has set itself a target of collecting tax arrears worth $136 million before the end of the year. So far, it has successfully collected $35 million. Tax evaders are preparing for more scrutiny, with one media outlet reporting that the province and its biggest cities and counties will begin intensive efforts to recover settlements.
Authorities have urged citizens to pay their dues, adding that they will sell their crypto to recover the dues if they fail.
“In order to boost fairness for honest taxpayers, we plan to take firm and strong measures over the next two months. We also urge delinquent taxpayers to pay their bills promptly. […] This will help prevent the seizure and sale of their assets.”
Crypto Stocks Rally
Publicly traded crypto and crypto-linked firms saw significant gains on October 14, following Bitcoin (BTC) ’s latest rally. Bitcoin miner CleanSpark was one of the day’s top performers, gaining almost 13%. The asset continued to climb during after-hours trading to settle at $11, according to data from Google Finance. Coinbase (COIN) also performed strongly, rising by 11.3%, reaching a seven-week high of $196. The asset continued to climb and settled at $199 during after-hours trading.
Crypto miner IREN also saw a double-digit increase, rising by 10.21%, while others such as TeraWulf (WULF) and MARA Holdings Inc (MARA) rallied by 6.65% and 5.6%, respectively. However, business intelligence firm MicroStrategy (MSTR) closed the day down by 5.1%.
Bitcoin (BTC) Price Analysis
Bitcoin (BTC) briefly pushed above $66,000 earlier today as markets continued to rally following several macroeconomic developments that have positively impacted the price. BTC is currently up by just over 2%, as buyers look to push back above $66,000 while sellers look to drive it below $65,000. Several economic and political factors are behind BTC and the market’s strong start to the week. BTC’s price jumped following Donald Trump’s rise in the presidential polls. With his pro-crypto stance, Trump has promised to support the crypto ecosystem. As such, analysts expect a bull run should he win the election. However, his opponent, Kamala Harris, has also focused on crypto and promised to protect investors by implementing a new regulatory framework.
Looking at the price chart, we see that BTC spent most of the previous week in the red, dropping below the 50-day SMA on Wednesday and hitting a day low of $58,927 on Thursday. Buyers eventually pushed BTC back above $60,000 as BTC closed the day at $60,312, after a decline of 0.52%. Despite strong bearish sentiment, BTC made a strong recovery on Friday, going back above the 50-day SMA after an increase of 3.54% and settled at $62,446. Buyers also attempted to push above the 20 and 200-day SMAs but were unsuccessful.
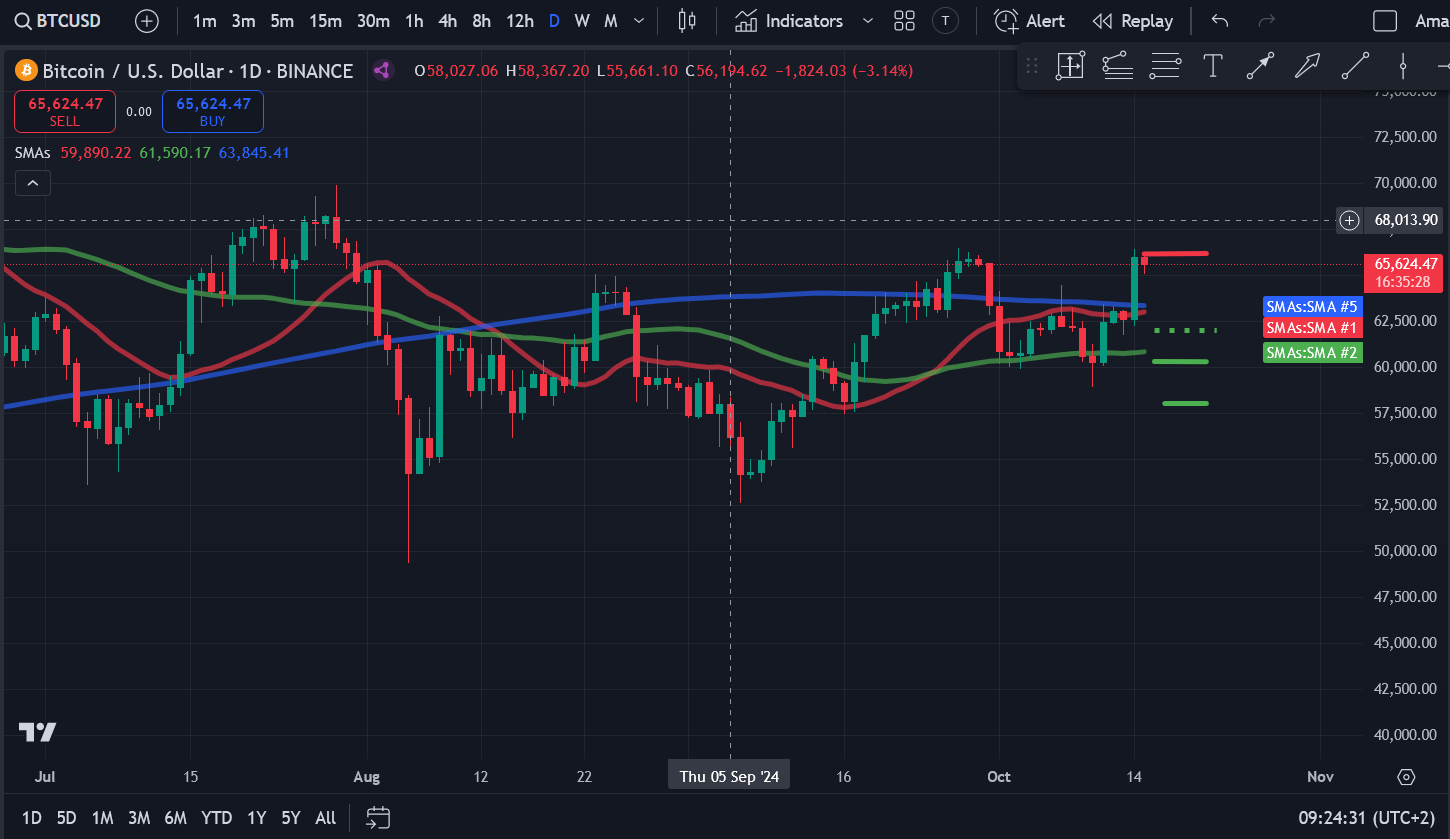
Source: TradingView
BTC continued its recovery on Saturday, going above the 20-day SMA and settling at $63,055. However, it could not push above the 200-day SMA thanks to strong selling pressure. As a result, the price fell back in the red on Sunday, with BTC dropping by 0.67% to slip back below the 20-day SMA and settle at $62,385. With markets picking up on Monday, BTC rallied as well, surging by 5.36% to go past the 20 and 200-day SMAs and the crucial $66,000 level. However, after briefly pushing above $66,000, BTC fell back marginally and closed Monday at $65,992, above a critical resistance level.
The current session sees BTC marginally down as bears attempt to push the price below $65,000. However, they have not been able to so far. Buyers will look to keep BTC above $65,000 and go back above $66,000. In such a scenario, BTC could surge to $70,000 if it breaks past $66,000. On the other hand, should sellers drive BTC back below $65,000, it could slip to $62,000 or $60,000.
Ethereum (ETH) Price Analysis
Ethereum (ETH) is up just over 3% and is trading above the crucial $2,600 level, with its latest rally allowing it to break past a stubborn level of resistance and moving averages. ETH began forming a base around the $2,350 price level at the beginning of October. However, its first rally from this level stalled around the 20 and 50-day SMAs. By the middle of last week, ETH fell back to a low of $2,351 before closing the session at $2,369. ETH began a steady recovery on Thursday, registering a marginal increase after facing considerable volatility, and settled at $2,384, just short of the $2,400 level.
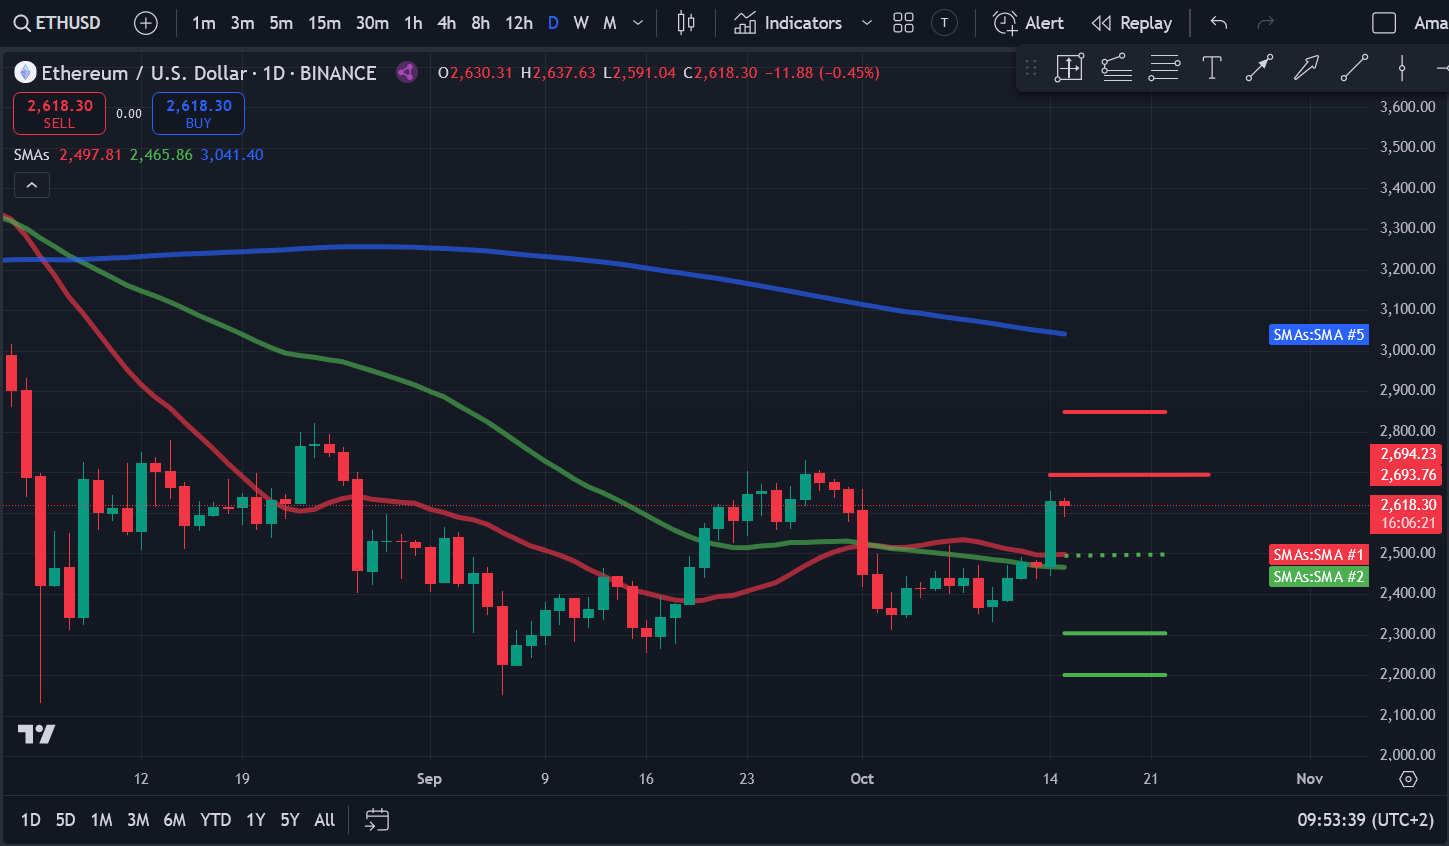
Source: TradingView
ETH pushed above $2,400 on Friday after registering an increase of 2.27% and settling at $2,438. Buyers also attempted to push above the 50-day SMA but were unsuccessful. ETH experienced a mixed weekend, registering an increase of 1.60% on Saturday to push above the 50-day SMA and settle at $2,477. However, it registered a marginal decline on Sunday to end the weekend on a negative note at $2,468.
ETH started the current week with a significant jump of almost 7% as the crypto markets made a broad recovery. As a result, ETH surged past $2,500 and $2,600 to settle at $2,630, going past a crucial level of resistance at $2,600. The current session sees ETH marginally down as sellers look to push the price back below $2,600. Sellers will look to drive ETH back towards $2,500 or lower. However, if ETH stays above these levels, its next target will be $2,700. A break above this level will see ETH push towards $2,850, another crucial level.
Solana (SOL) Price Analysis
Solana (SOL) has been highly bullish since dropping to a day low of $135 on Thursday after a failed push to move past the 20-day SMA earlier in the week. After falling to a low of $135 on Thursday, buyers pushed the price back up to $139, ending the day with only a marginal decline. However, SOL rebounded strongly from this level, reclaiming $140 and surging past the 50-day SMA after an increase of almost 5%, pushing it to $145. SOL continued to move higher over the weekend, registering a rise of 0.66% on Saturday and settled at $146.
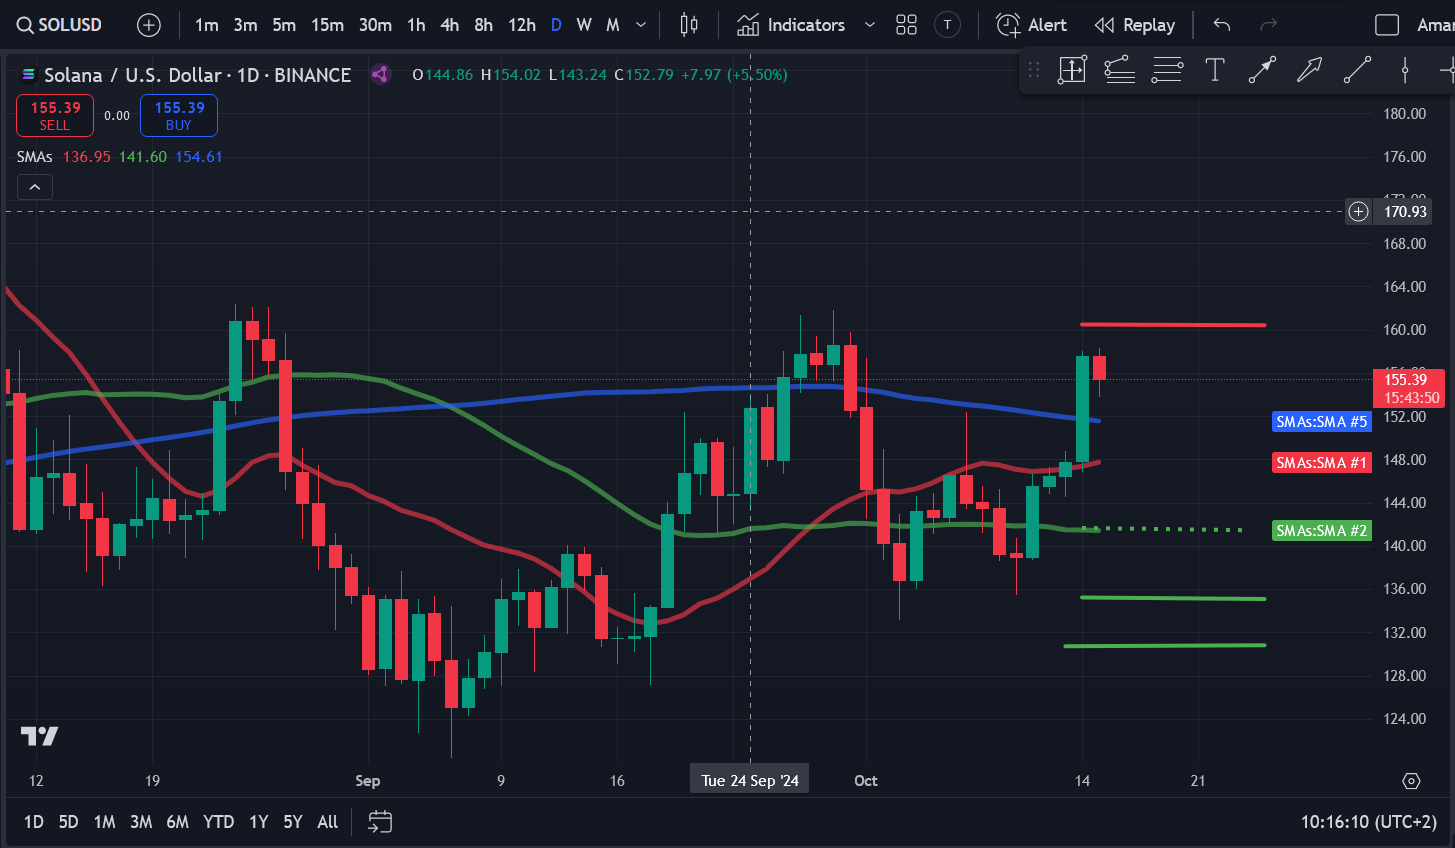
Source: TradingView
SOL experienced considerable volatility on Sunday as sellers looked to drive SOL below $140. However, buyers countered the selling pressure, and SOL registered a jump of 0.91%, which allowed it to push above the 20-day SMA and settle at $147. The current week began with strong bullish sentiment dominating the market. As a result, SOL surged by almost 7% to go past the 200-day SMA and $150 to $157. However, SOL is back in the red during the ongoing session as sellers look to drag the price back below $150.
If SOL can stay above $150, buyers will look to regain control and push the price to $160. However, sellers are expected to strongly defend this level. On the other hand, if SOL drops back below $150, it could drop to $140.
Dogwifhat (WIF) Price Analysis
Solana-based meme coin Dogwifhat (WIF) ’s recovery has stalled after it failed to push above $3 on Monday, with the popular token trading in the red during the ongoing session. WIF started the previous week in the red and dipped to $2.32 by Wednesday. Sellers attempted to drag the price lower on Thursday as it fell to a low of $2.21. However, it recovered from this level, rebounding from the 20-day SMA. As a result, WIF registered an increase of almost 5% and moved to $2.43. Bullish sentiment intensified on Friday as WIF surged an incredible 13.40% to past crucial resistance levels at $2.50 and $2.60 to settle at $2.75.
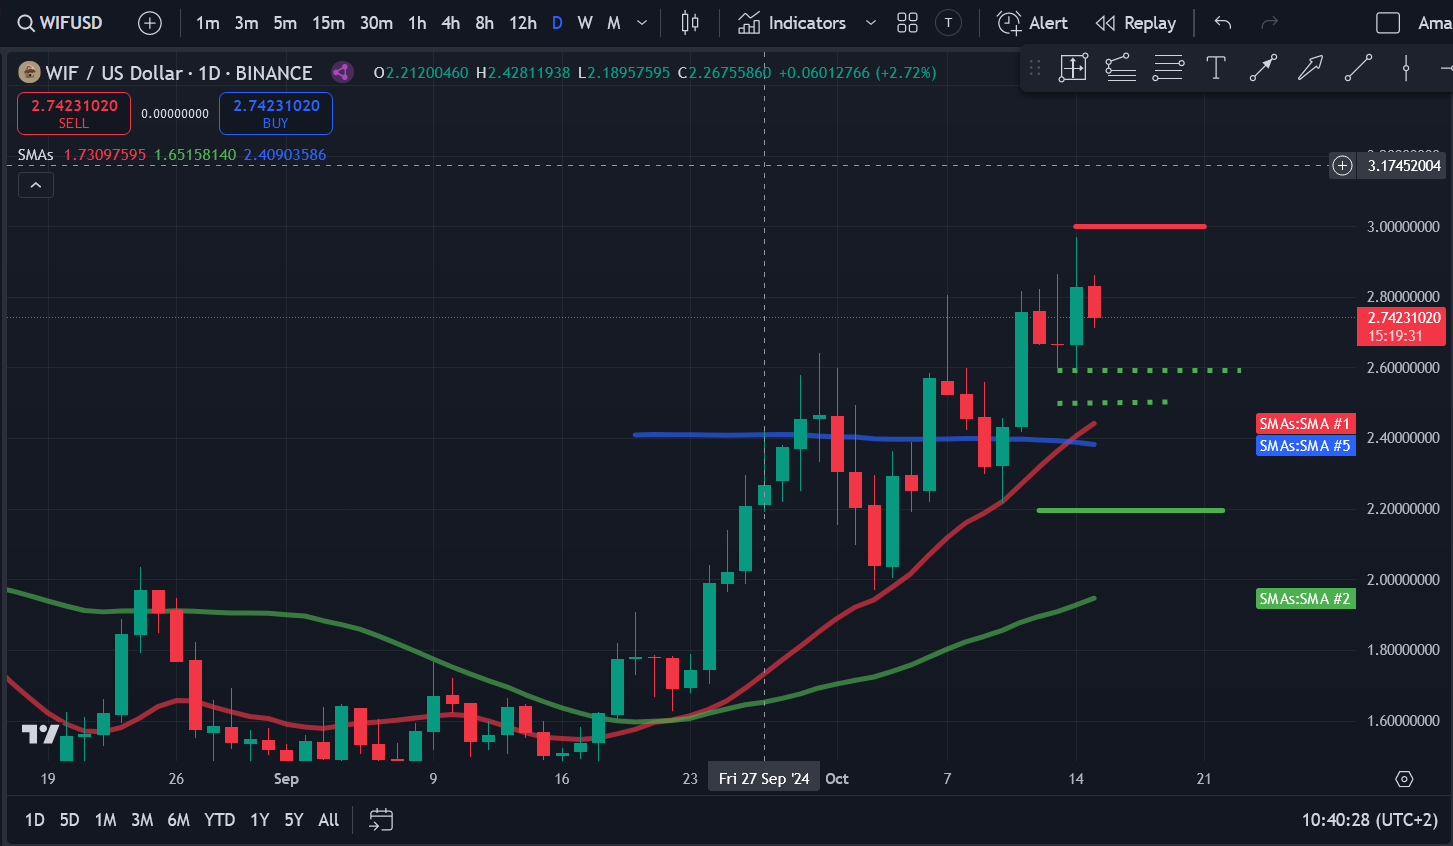
Source: TradingView
However, it lost steam over the weekend, falling back by 3.15% on Saturday and settling at $2.67. The meme coin experienced significant volatility on Sunday as buyers attempted to push the price towards $3 while sellers sought to drag the price below $2.50. Ultimately, WIF registered only a marginal drop and settled at $2.66. The current week began with sellers attempting to push WIF below $2.50. However, WIF rebounded after reaching a low of $2.59 and registered an increase of just over 6% to move to $2.82. Buyers attempted to push the price to $3 but lost steam after reaching a high of $2.97, indicating strong resistance at $3. The current session sees WIF down by just over 3% as sellers look to push the price back below $2.60.
Uniswap (UNI) Price Analysis
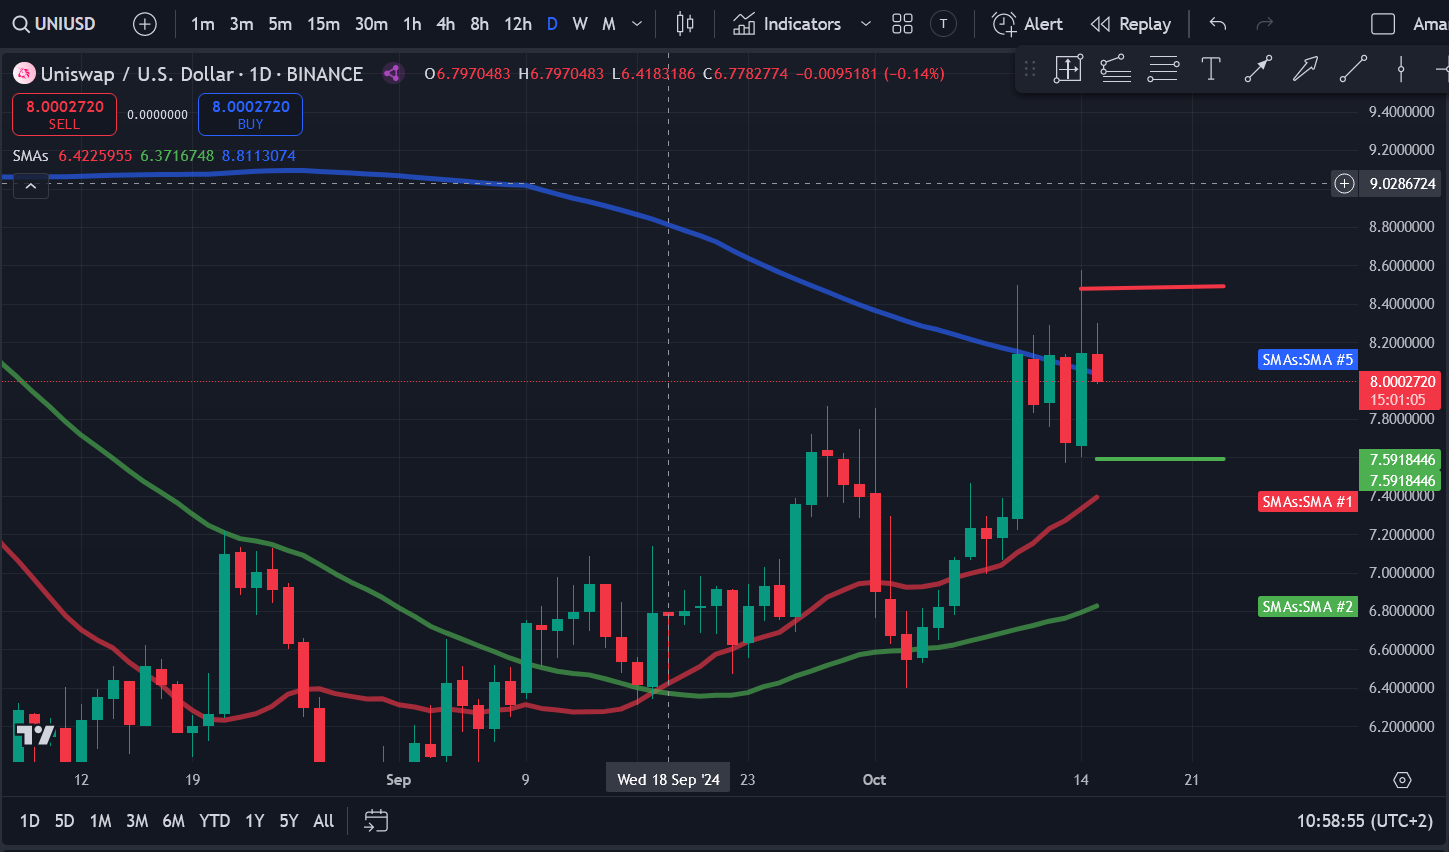
Uniswap (UNI) is struggling to push above $8.20 and the 200-day SMA as its recovery stalls in the face of strong selling pressure. UNI has been bullish since the beginning of October and registered an increase of almost 12% on Thursday to push above $7.50 and settle around the $8.13 mark. Buyers attempted to push the price higher but could not do so, thanks to intense selling pressure. With the 200-day SMA acting as a dynamic level of resistance, UNI fell back in the red on Friday, dropping by 3.20% to $7.87.
Source: TradingView
It rebounded on Saturday, registering an increase of 3.23% and settling at $8.13, unable to push higher thanks to intense selling pressure. As a result, UNI fell back in the red on Sunday, ending the week on a bearish note after dropping by almost 6% to $7.67. The current week began with buying activity picking up once again as UNI surged to a day high of $8.57. However, with buyers losing momentum at higher levels, UNI fell back and settled at $8.14, just above the 200-day SMA, registering an increase of just over 6%. The current session finds UNI back in the red as sellers look to drag the price below $7.50.
Looking at the price chart, we can see that UNI is trading between $7.50 and $8.50. If UNI drops below $7.50, it could drop to $7. On the other hand, buyers will look to regain control and push UNI back above $8 and towards $8.50.
Internet Computer (ICP) Price Analysis
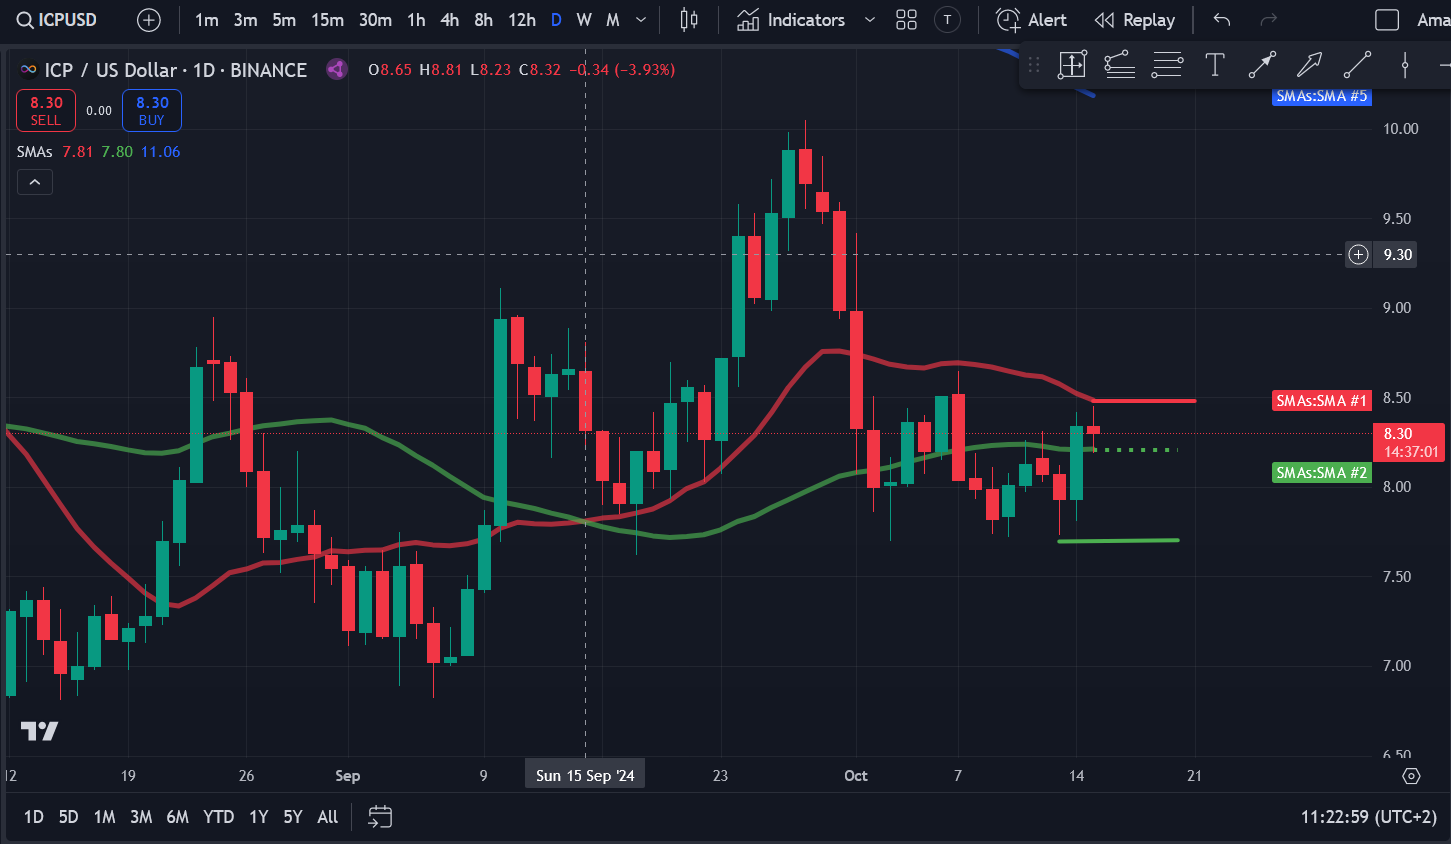
Internet Computer (ICP) is looking to push above $8.50 as it looks to break out of a recent trading range extending from $7.50 to $8.50. ICP slipped below $8 on Wednesday as it dropped to $7.82. However, it quickly recovered on Thursday, climbing back above $8 after an increase of 2.43%. It continued to push higher on Friday, rising to $8.13 after a jump of 1.50%. Buyers attempted to push ICP above the 50-day SMA but could not do so, with buyers losing momentum after reaching a high of $8.26.
Source: TradingView
ICP fell back in the red over the weekend after another failed attempt to push above the 50-day SMA, with sellers dragging the price down by 0.74% to $8.07. ICP slipped below $8 once again on Sunday, dropping to a day low of $7.73 before buyers propped the price back to $7.93. The current week began with ICP making a strong recovery, with the price rising over 5% to push above the 50-day SMA and settle at $8.34. The current session sees ICP marginally down as sellers look to push it back below the 50-day SMA and $8.
Optimism (OP) Price Analysis
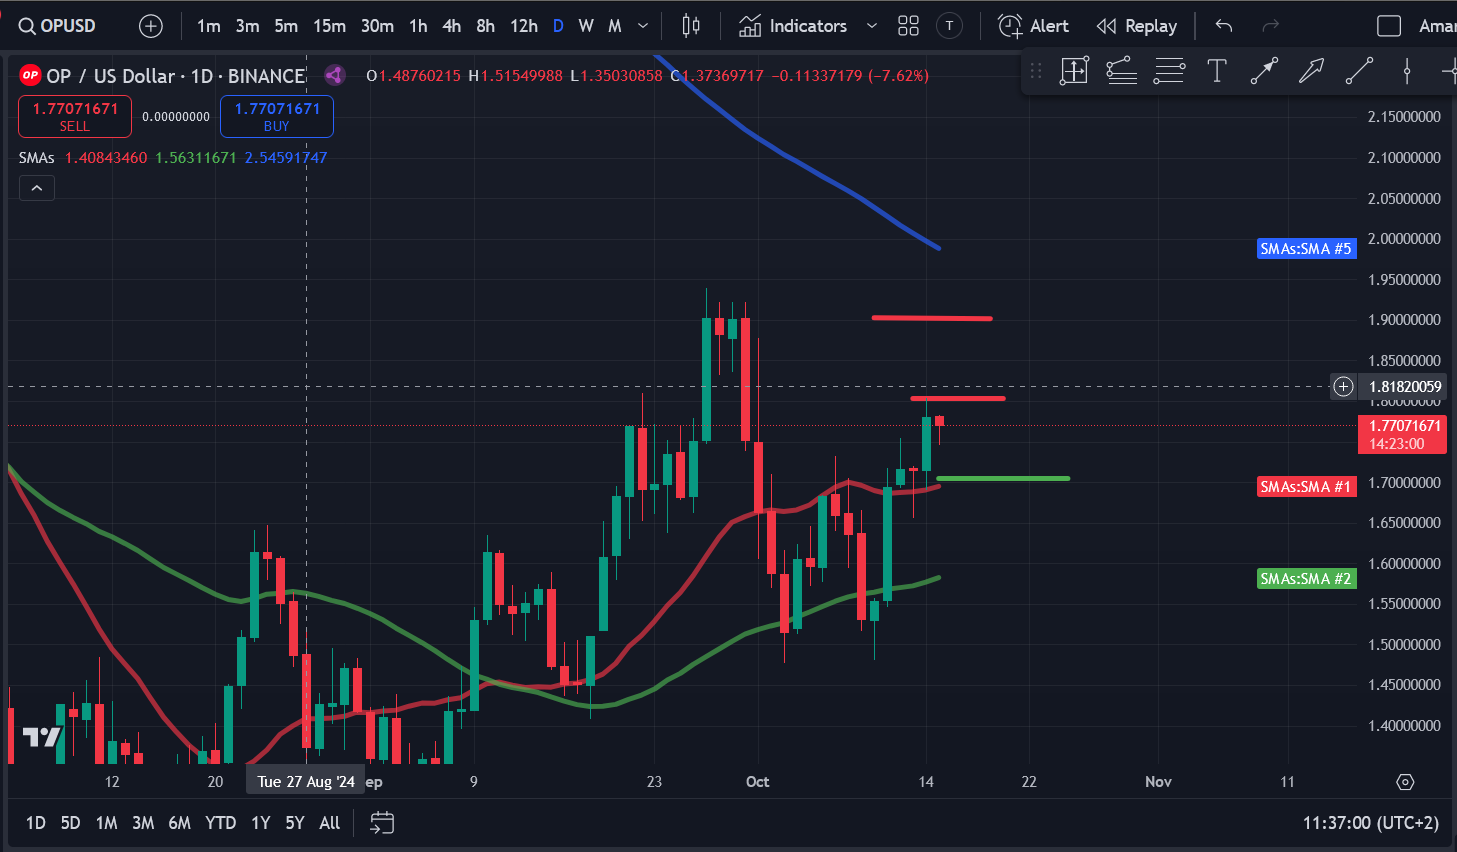
Optimism (OP) is looking to push above $1.80 and make its way towards the resistance at $1.90 after making a strong recovery towards the end of the previous week. OP dropped to a day low of $1.48 on Thursday before recovering and registering a 1.49% increase to $1.55. OP continued to push higher on Friday, rising by almost 9%, pushing above the 50-day SMA and 20-day SMA and settling at $1.69. Saturday saw OP register an increase of 1.36% to move to $1.71.
Source: TradingView
However, volatility picked up on Sunday as sellers attempted to drag the price below the 20-day SMA. As a result, OP fell to a day low of $1.65 before pushing back above the SMA and settling at $1.71, registering only a marginal decline. The current week began on a bullish note as OP registered an increase of 3.80% to settle at $1.78. However, the current session finds OP back in the red, with the price marginally down and trading around the $1.77 mark.
Disclaimer: This article is provided for informational purposes only. It is not offered or intended to be used as legal, tax, investment, financial, or other advice.