ARTICLE AD
The recent approval of the Ethereum ETF applications by the US Securities and Exchange Commission (SEC) on Thursday has sparked speculation on the next price movements for the market’s second-largest cryptocurrency as the trading launch date approaches.
However, significant transfers of Ethereum (ETH) to cryptocurrency exchanges have raised concerns about profit-taking, portfolio rebalancing, and potential market speculation.
Sell-Off Amidst Ethereum ETF Greenlight?
According to crypto analyst Ali Martinez, these developments coincide with Ethereum founder Jeffrey Wilke transferring 10,000 ETH, valued at approximately $37.38 million, to the cryptocurrency exchange Kraken.
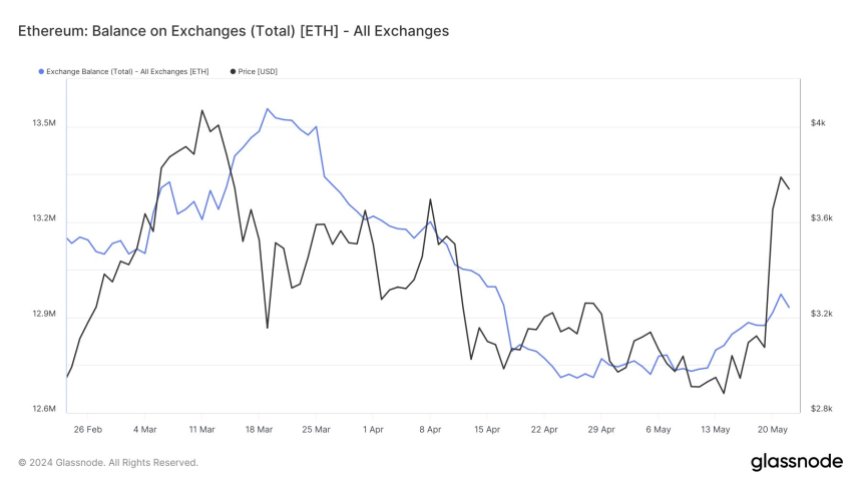
Furthermore, the surge in Ethereum balances on cryptocurrency exchanges indicates a notable increase in tokens available for sale.
The chart below shows that more than 242,000 ETH have been transferred to cryptocurrency exchange wallets over the past two weeks, signaling increased trading activity that can contribute to price volatility.
 ETH balance on all exchanges. Source: Ali Martinez on X
This trend, coupled with Wilke’s transfer, suggests the possibility of a sell-off or an increase in profit-taking among market participants.
While industry experts like Anthony Pompliano view the Ethereum ETF approval as a positive sign for the entire industry, traders are advised to exercise caution. For Martinez, the growing number of ETH deposits to exchange wallets implies a potential market reaction characterized by profit-taking or selling pressure.
Additionally, the analyst notes that the Tom DeMark (TD) Sequential indicator has presented a sell signal on Ethereum’s daily chart, indicating the potential for a retracement or a new downward countdown phase before the upward trend resumes.
Ethereum’s Price Outlook In Focus
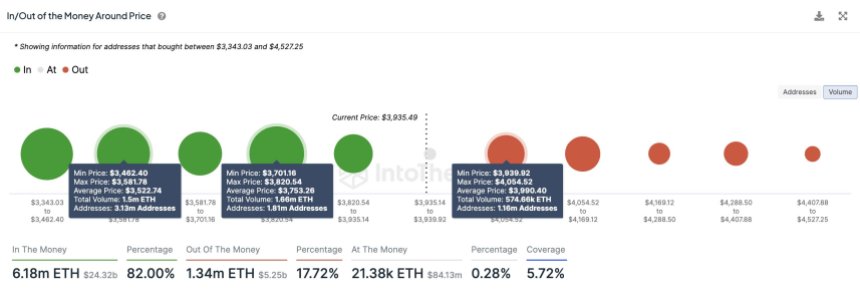
Diving into the price analysis, considering the IOMAP (Input-Output Model and Profitability) data, Martinez highlights that Ethereum has a strong demand zone between $3,820 and $3,700, where over 1.81 million addresses bought approximately 1.66 million ETH.
 ETH demand zones. Source: Ali Martinez on X
This range could provide support amid increasing selling pressure. However, if this zone fails to hold, the next key area of support lies between $3,580 and $3,462, where 3.13 million addresses acquired over 1.50 million ETH.
On the upside, Ethereum’s most significant resistance barrier is between $3,940 and $4,054, with over 1.16 million addresses purchasing around 574,660 ETH.
Martinez suggests that a daily candlestick close above $4,170 would invalidate the bearish outlook and potentially trigger a new upward countdown phase, with a target towards $5,000.
As of this writing, ETH’s price is $3,719, reflecting a 2.5% retracement over the past 24 hours. However, according to the analyst’s assessment, Ethereum remains within a crucial demand zone.
As the market approaches the launch and commencement of trading for all eight spot Ethereum ETF applications by the world’s largest asset managers, the exact impact on price action is yet to be fully realized.
Featured image from Shutterstock, chart from TradingView.com

 7 months ago
50

