ARTICLE AD
In the third week of January, Bitcoin (BTC) demonstrated a modest 3% price recovery, following increased selling pressure exerted by asset manager Grayscale since January 12.
Interestingly, there are indications that this selling pressure is now diminishing, pointing towards a potential restart of the bullish trend that Bitcoin has been experiencing since October 2023.
Grayscale’s Resumed Selling Spree
As previously reported, since the approval of the Bitcoin spot exchange-traded fund (ETF), Grayscale has deposited a significant sum of 103,134 BTC ($4.23 billion) into Coinbase Prime as of January 25.
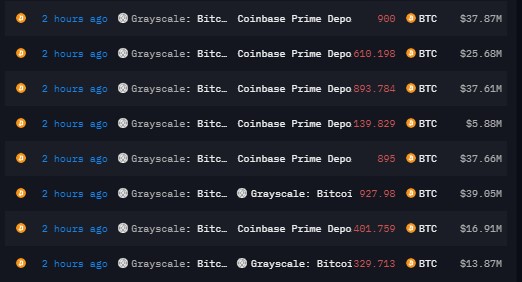
However, recent data from Arkham Intelligence, which tracks Grayscale’s transfers, reveals that the asset manager sent an additional 11,800 BTC to Coinbase on Friday. Furthermore, Grayscale has resumed its selling spree as the month draws to a close, with a fresh transfer of 8,670 BTC sent to Coinbase for selling on Monday.
 A portion of Grayscale’s latest BTC was transferred to Coinbase. Source: Arkham Intelligence
Grayscale has now sent 123,604 BTC to the exchange, with an approximate value of over $5 billion. However, it is important to note a key aspect amidst this ongoing selling spree.
Despite the continuous selling activity, this latest transfer to Coinbase represents Grayscale’s smallest amount of BTC to the exchange for selling purposes. This development suggests the possibility of a reduction in the selling spree, potentially paving the way for Bitcoin’s price to make another upward move and regain previously lost levels.
Bitcoin Price Outlook Brightens
Renowned crypto analyst Rekt Capital has provided insights into Bitcoin’s recent price action, highlighting significant levels and indicators to watch.
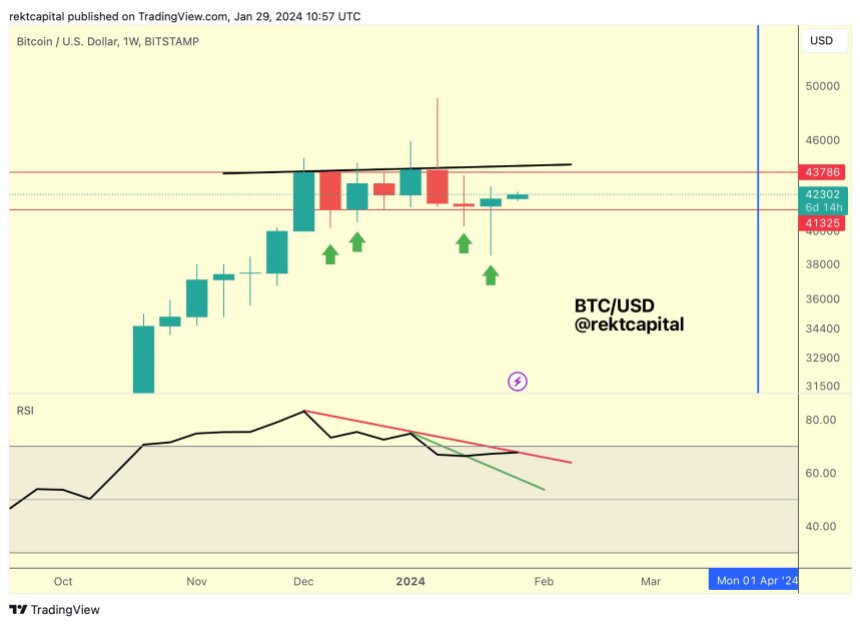
According to Rekt’s analysis, Bitcoin’s weekly close managed to surpass the lower boundary of a key range, which was around $41,300. This breakout from the low range is seen as a positive development for cryptocurrency.
 BTC’s RSI points to a price recovery to the $43,000 level. Source: Rekt Capital on X
Rekt Capital also points out that BTC’s Relative Strength Index (RSI), a widely used momentum indicator, is currently challenging the downtrend line (in red in the chart above).
Rekt suggests that if the RSI can break above this downtrend line, it would invalidate the bearish divergence. A bearish divergence occurs when the price of an asset is rising, but the related indicator, in this case, the RSI, is moving in the opposite direction.
Should the RSI successfully break above the downtrend line, Rekt Capital believes that Bitcoin could potentially revisit the upper boundary of the mentioned range, which is approximately $43,800. Reaching this range high would indicate a further recovery in Bitcoin’s price.
In the meantime, BTC continues to regain upper territory, currently trading at $42,645, representing a 1.5% price recovery in the past 24 hours.
Featured image from Shutterstock, chart from TradingView.com
Disclaimer: The article is provided for educational purposes only. It does not represent the opinions of NewsBTC on whether to buy, sell or hold any investments and naturally investing carries risks. You are advised to conduct your own research before making any investment decisions. Use information provided on this website entirely at your own risk.

 1 year ago
33

