ARTICLE AD
In his latest technical outlook, crypto analyst Dark Defender has highlighted the key takeaways for XRP amid recent price action. Since hitting a yearly high of $0.64 on January 3, the XRP price has dropped -18.8%, leaving it at risk of further downside before the bulls could take over.
XRP Price Set For Final Dip?
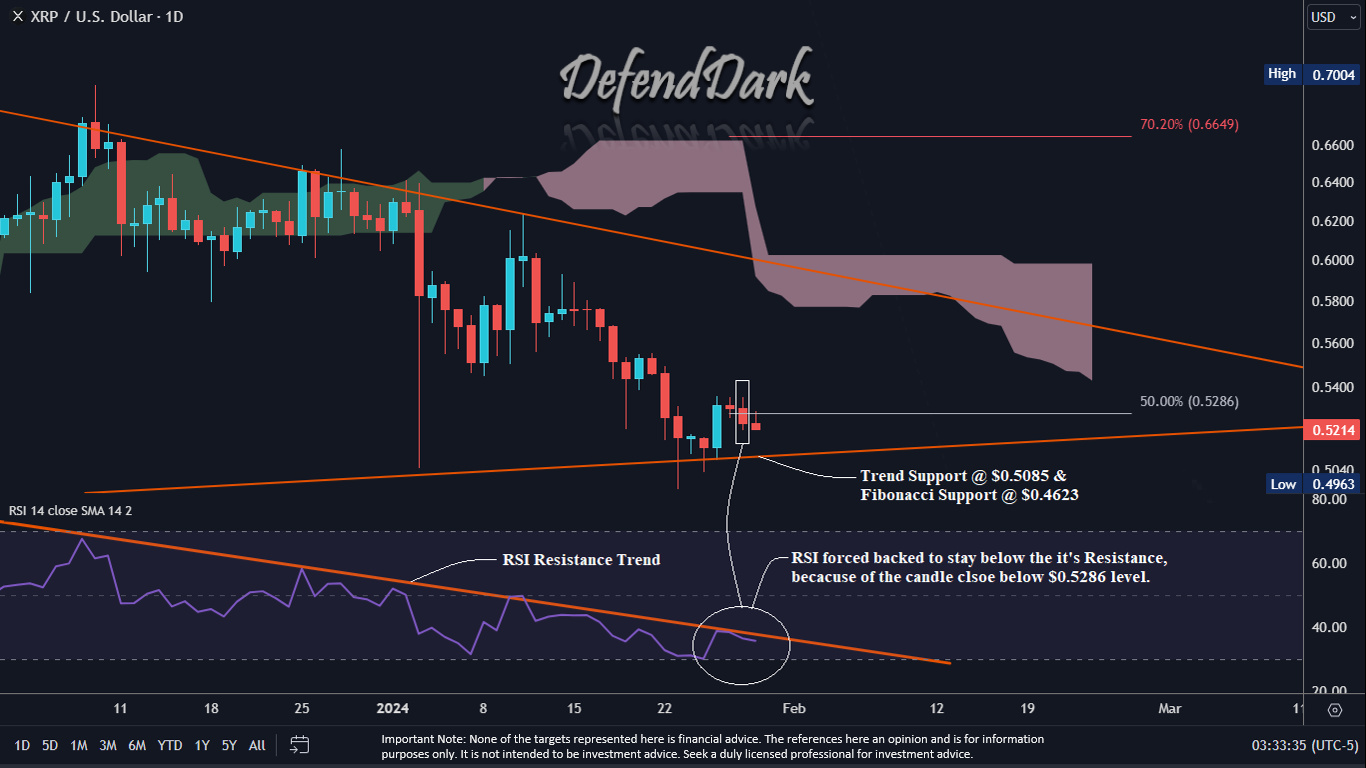
According to the provided daily XRP/USD chart, the price closed below the significant level of $0.5286. As a result, the RSI has been “forced to stay below the Resistance Trend Line,” implying that bears are currently in control, exerting downward pressure on the price.
 Price analysis, 1-day chart | Source: X @DefendDark
Remarkably, the price has been in a symmetrical triangle formation since November last year, which is considered a bullish continuation pattern. The XRP price has already been rejected three times at the descending resistance line. In tandem, the RSI on the 1-day chart has also formed a descending trend line. Each time the price was rejected at the resistance line, there was also a rejection of the RSI at the trend line.
Yesterday, Sunday, it looked as if XRP could break above the rising trend line of the RSI, and the price could follow suit and start another attempt to break out of the symmetrical triangle. Dark Defender wrote:
XRP moved towards $0.52-$0.53 as we expected. The target area was $0.5286 and XRP closed just above that level yesterday and had a break on the RSI. This is a great sign for XRP shortly to try the $0.60 Resistance […] But of course, will be more than happy to see XRP breaking $0.6649 first & proceed with the initial Fibonacci Target of Wave 3 at $1.88.
However, this game plan was invalidated as XRP closed below $0.5286 and the RSI trend line. Now, the analyst identifies two key support levels, the trend support at $0.5085 and the Fibonacci support at $0.4623. These levels are now considered pivotal as XRP trades under the $0.53 threshold.
Dark Defender emphasizes the importance of these supports: “So, $0.5085 & $0.4623 supports become more important now.”
The daily RSI indicator also suggests that XRP is in the oversold region, which typically indicates that the asset may be undervalued and could possibly reverse to the upside. However, the analyst cautions that the “weekly frame trumps the daily,” suggesting that longer time frames may influence the asset’s price more significantly. “The more XRP stays below $0.52, the more support becomes prominent,” he added.
Looking forward, Dark Defender anticipates a potential “wick below these levels to complete this exasperating correction” and hints at an eventual recovery, with expectations set towards “Wave 3 in the end.” This reference to Elliott Wave Theory suggests that following the correction, a strong upward trend could emerge. The final price target would then be $1.88.
Despite the current market conditions, Dark Defender advises the community to maintain a positive outlook: “Be positive and be strong since this will be over.” The statement conveys a sense of resilience and long-term perspective amid short-term market fluctuations.
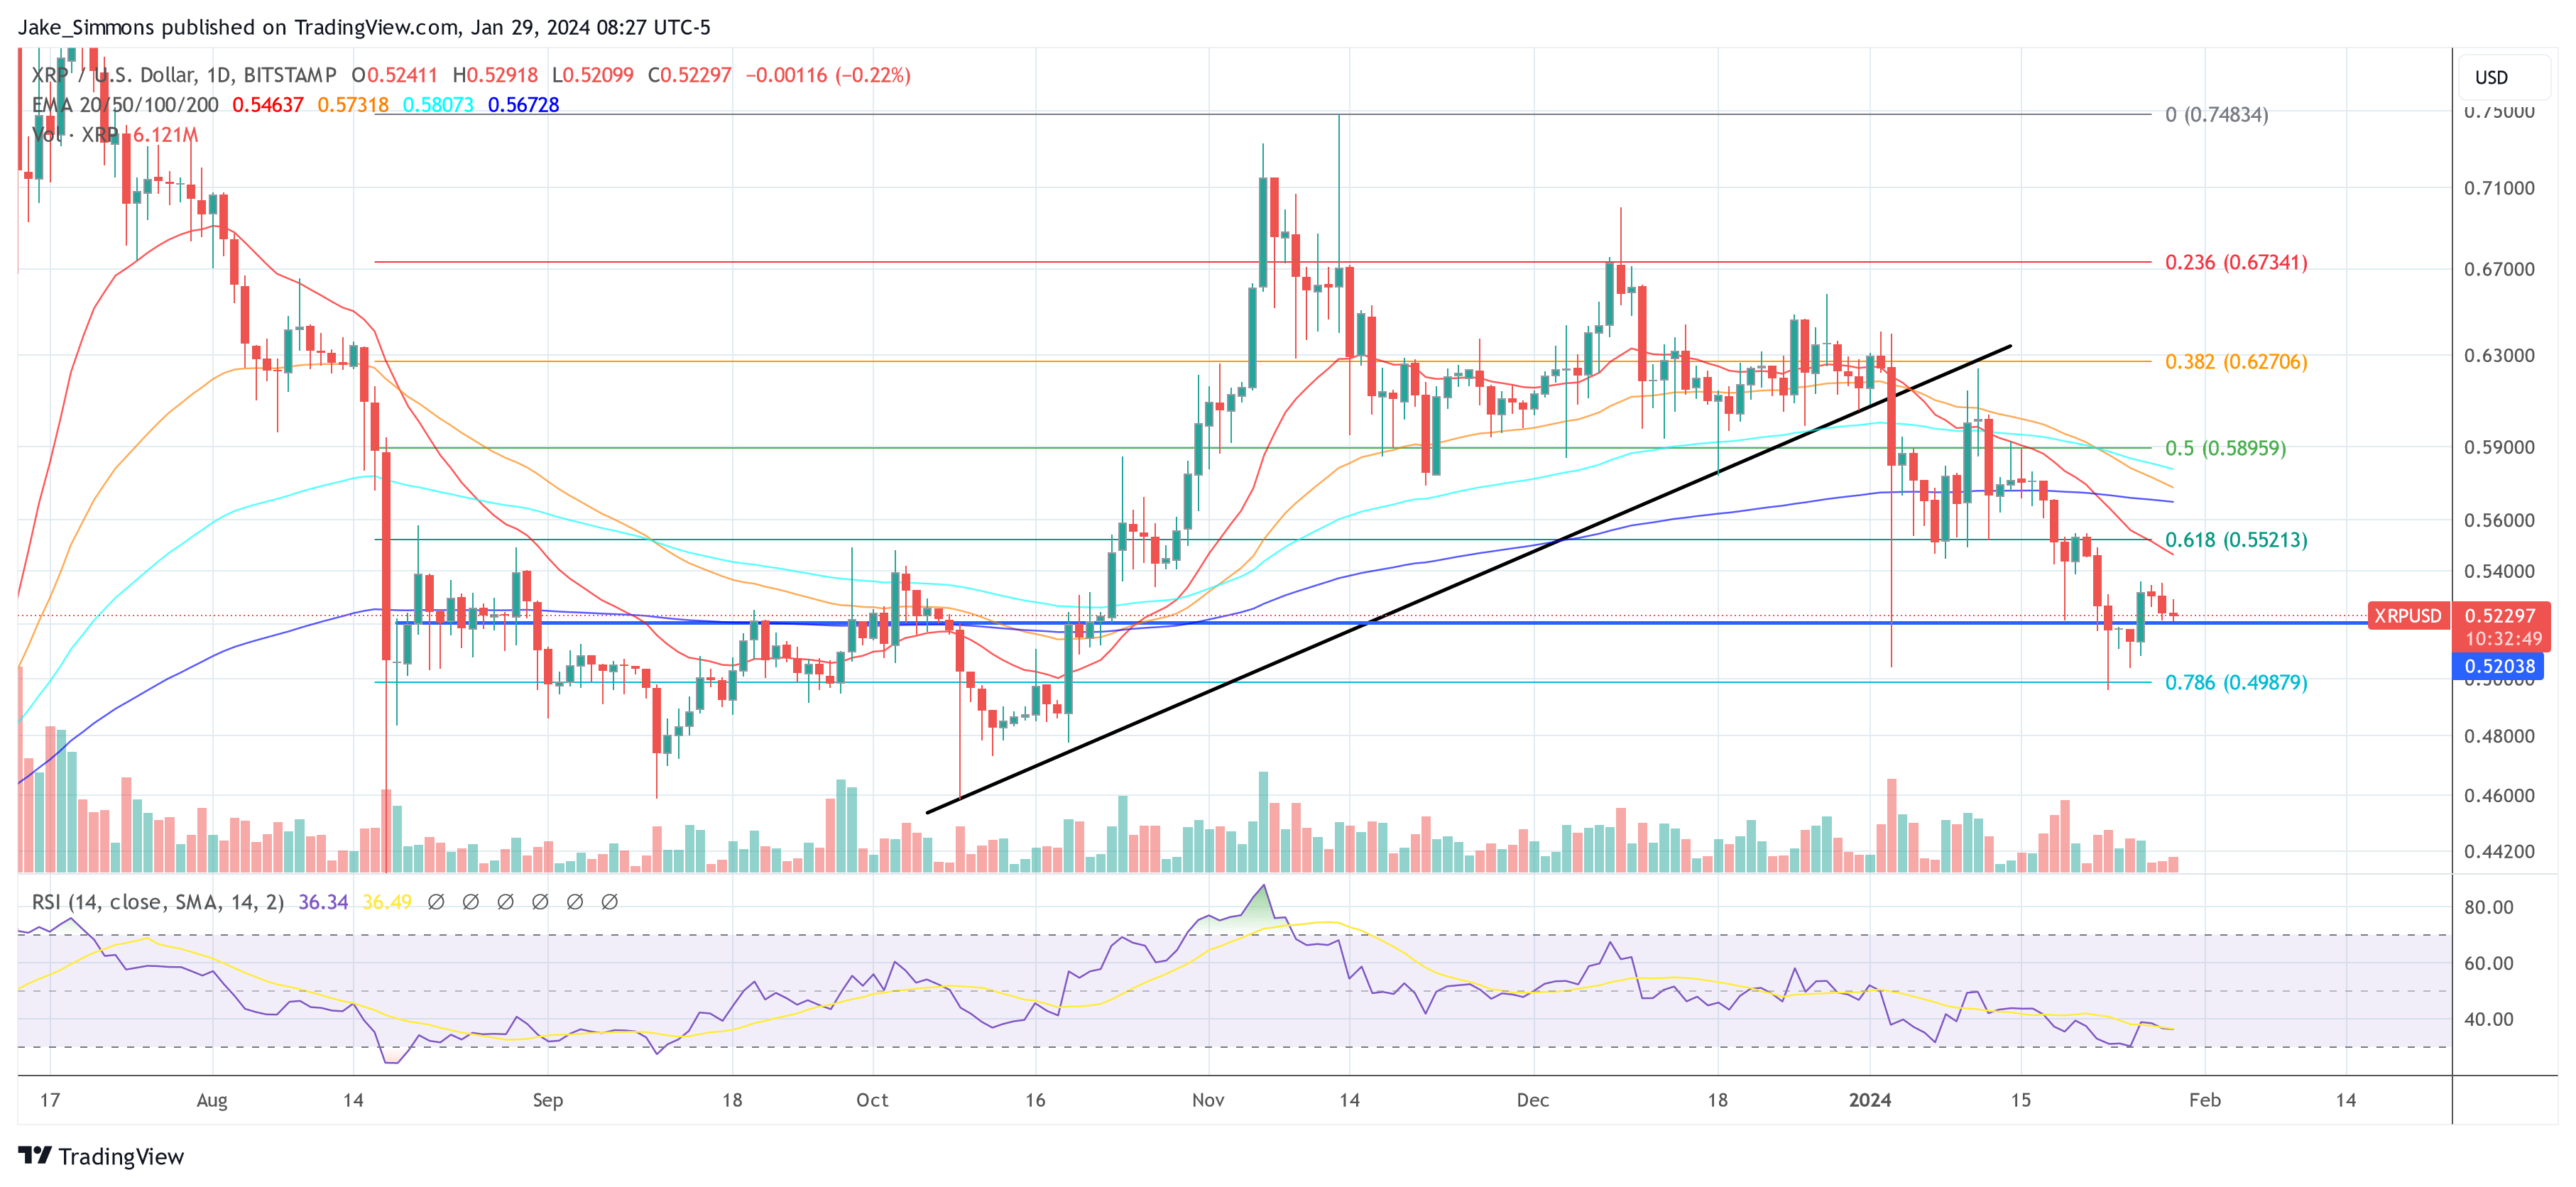
At press time, XRP traded at $0.52297.
 XRP price, 1-day chart | Source: XRPUSD on TradingView.com
Featured image from Shutterstock, chart from TradingView.com
Disclaimer: The article is provided for educational purposes only. It does not represent the opinions of NewsBTC on whether to buy, sell or hold any investments and naturally investing carries risks. You are advised to conduct your own research before making any investment decisions. Use information provided on this website entirely at your own risk.

 1 year ago
71

